Sampling large data sets (Part 1)

The amount of data is large. Before we analyze the whole set of data, we can find trends
by examining a smaller set of sensors. A smaller set is also useful if we want to
train a model.
One of extracting a smaller set from the data is to generate a Latin hypercube sample from a uniform three-dimensional distribution.
The R package lhs can be used to generate a sample:
  # Install and load the lhs library
  install.packages("lhs")
  library("lhs")

  # Create a Latin Hypercube sample of coordinates between 0 and 1
  # 100 samples, 3 dimensions
  sampleCoords <- randomLHS(100, 3)
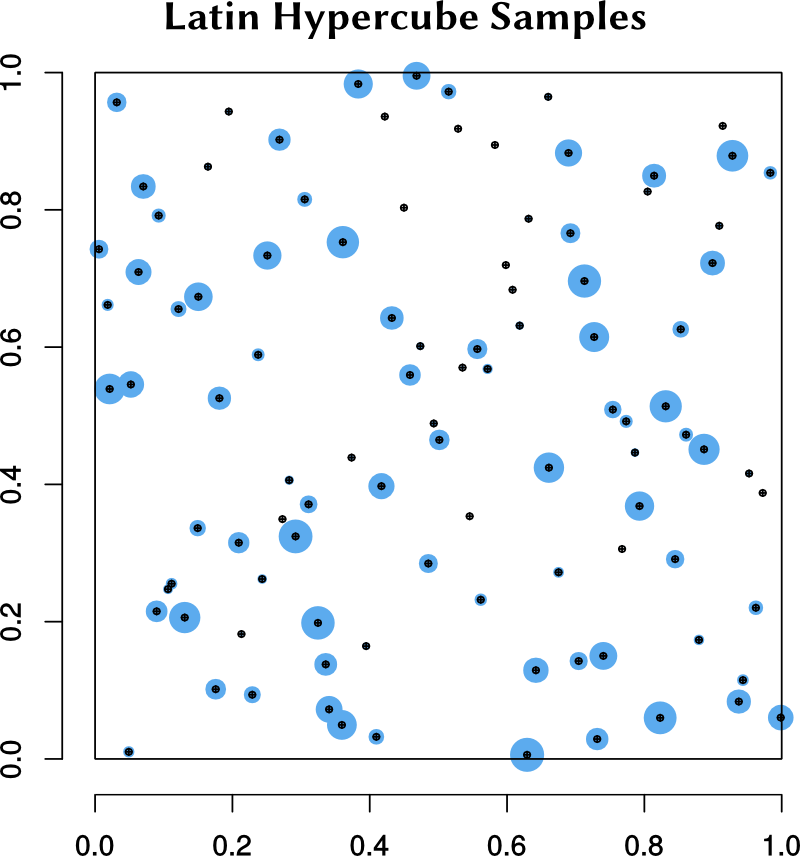
The sampling algorithm produces a set of points whose coordinates are in \([0,1]\). The
adjacent figure shows some of the points. Blue circles indicate the distance of the point
from the plane of the screen.
To get a set of sample points that samples the sensor positions equally well, we have to map the cube into a cylinder.
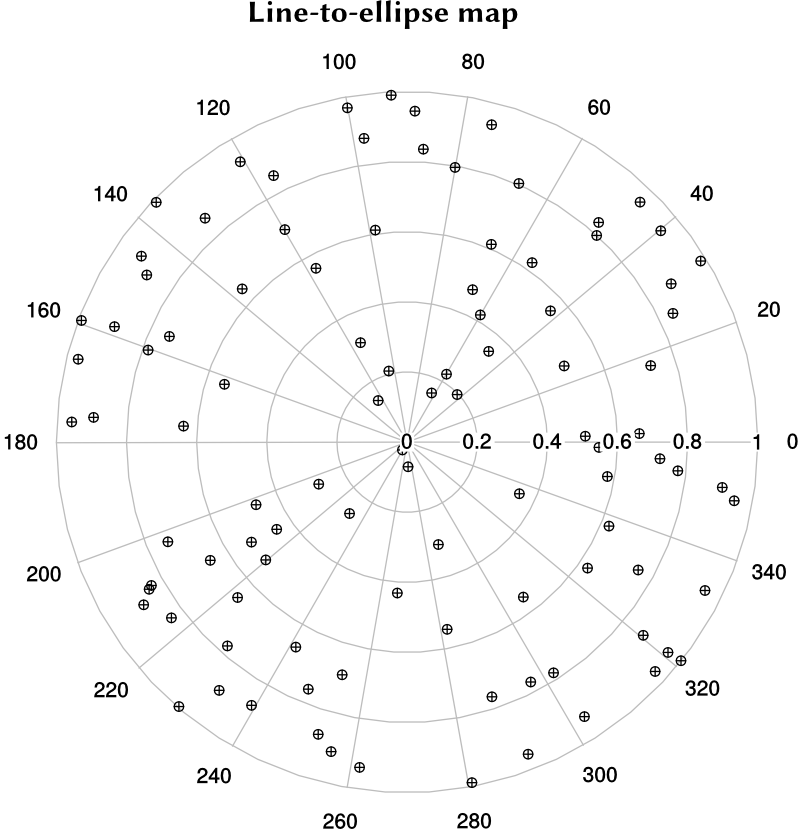
A simple map that takes lines in the \([-1,1]\) square to ellipses in the unit circle is
\(r = \sqrt{x^2 + y^2 - x^2\,y^2} \,,\) \(\theta = \tan^{-1}\left(\cfrac{y\sqrt{1-x^2/2}}{x\sqrt{1-y^2/2}}\right) \,,\) \(z = z \,.\)
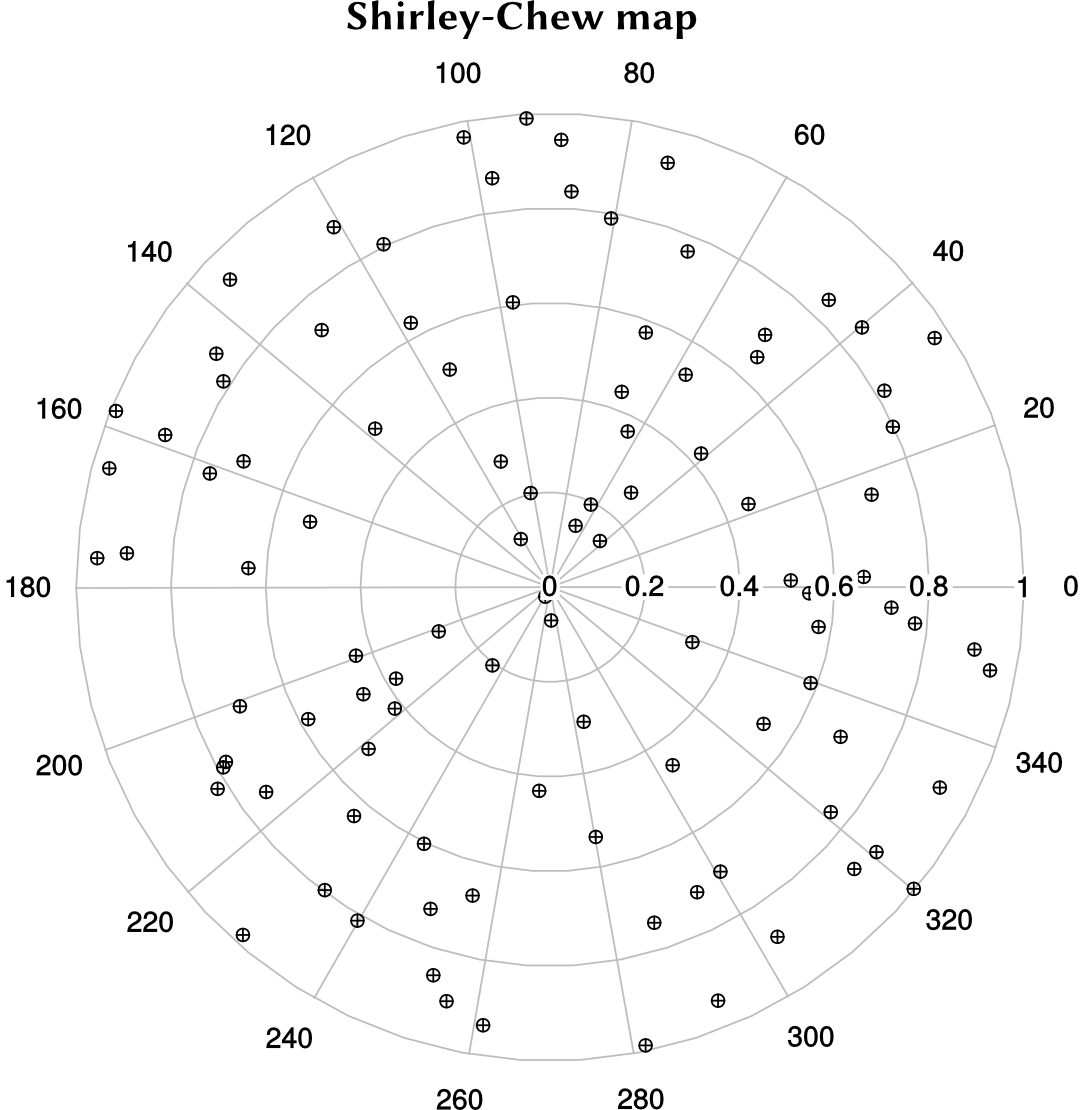
A slightly better map is the Shirley-Chew idea that attempts to reduce distortion during mapping. Polar plots of the mapped LHS points show how the two maps operate.
 |
 |
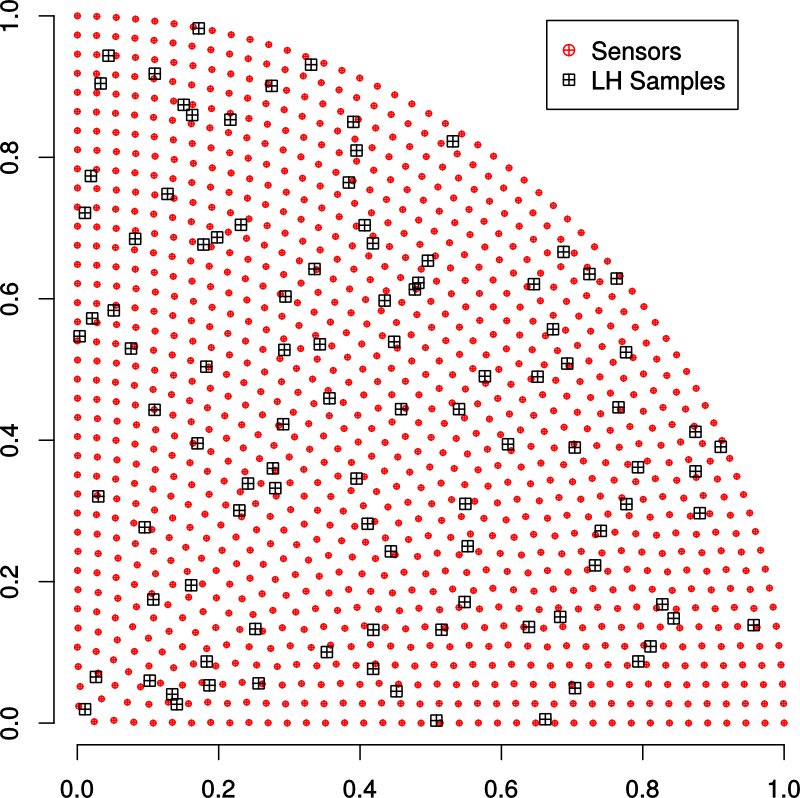
The sample coordinates generated in the unit disk can then be transformed so that
they lie in the first quadrant.
Now that we have the samples, the next step is to find the sensors that are closest to the sample points in some manner. The next post will discuss how that is done.